Back to the shop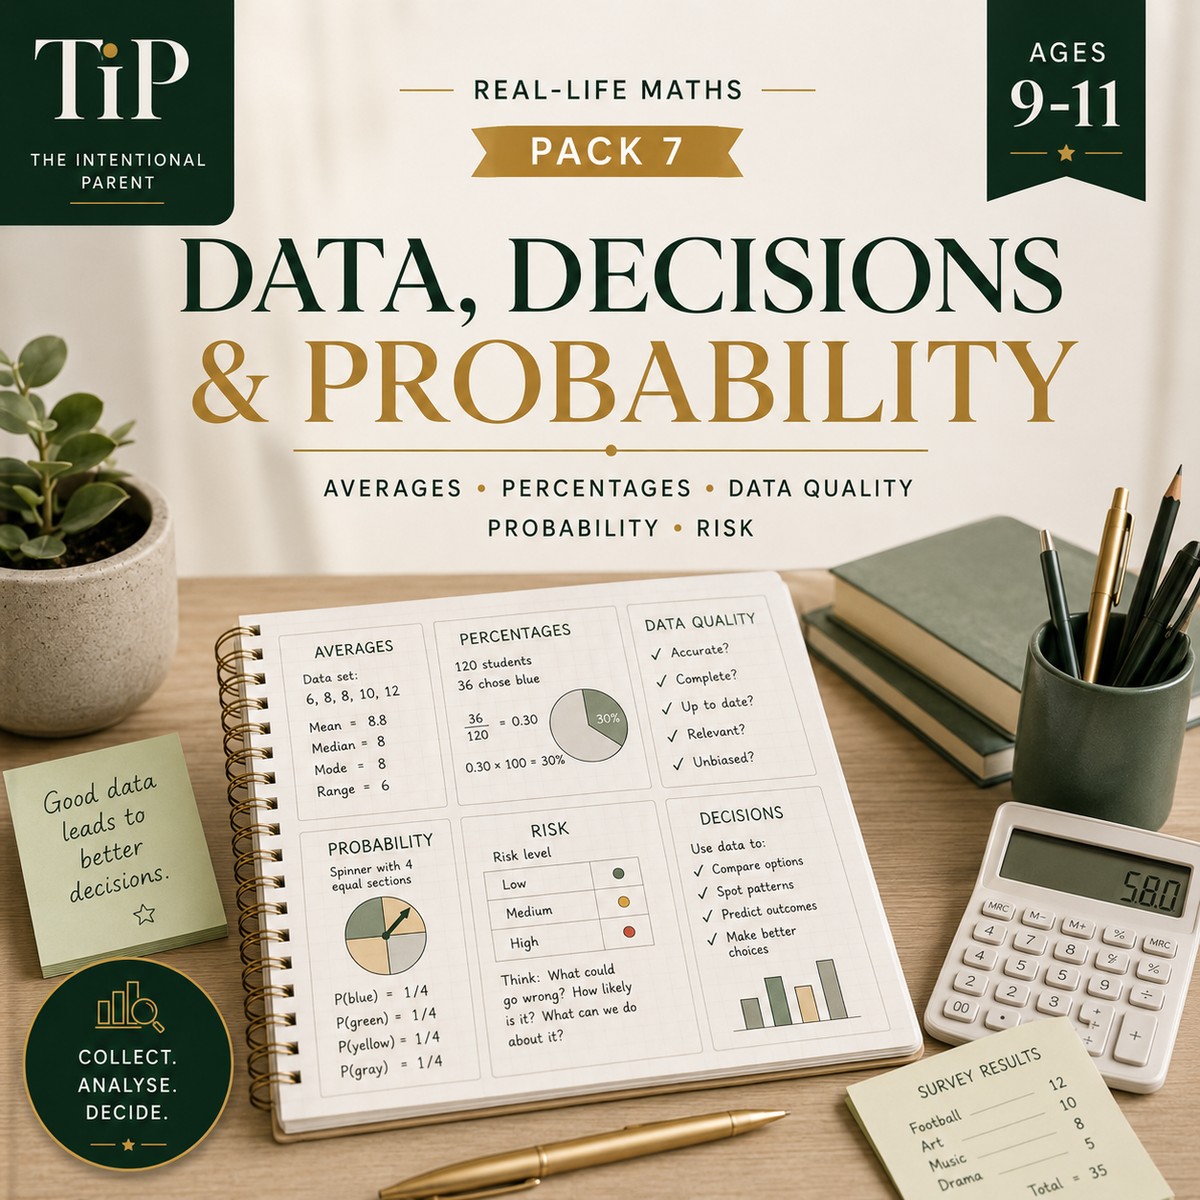
Ages 9 to 11
Data, Decisions & Probability
Real-Life Averages, Surveys, Misleading Data, Risk & Evidence-Based Decisions
£2.99
Secure payment. Your download appears the moment you've paid.
The seventh pack in the Ages 9 to 11 Maths collection. Children learn to read and question data: mean, median, mode and range, sample size and bias, leading survey questions, percentage change, misleading graphs, correlation versus cause, probability as fractions and percentages, fair games, risk and reward, and turning evidence into a real decision.
What's included
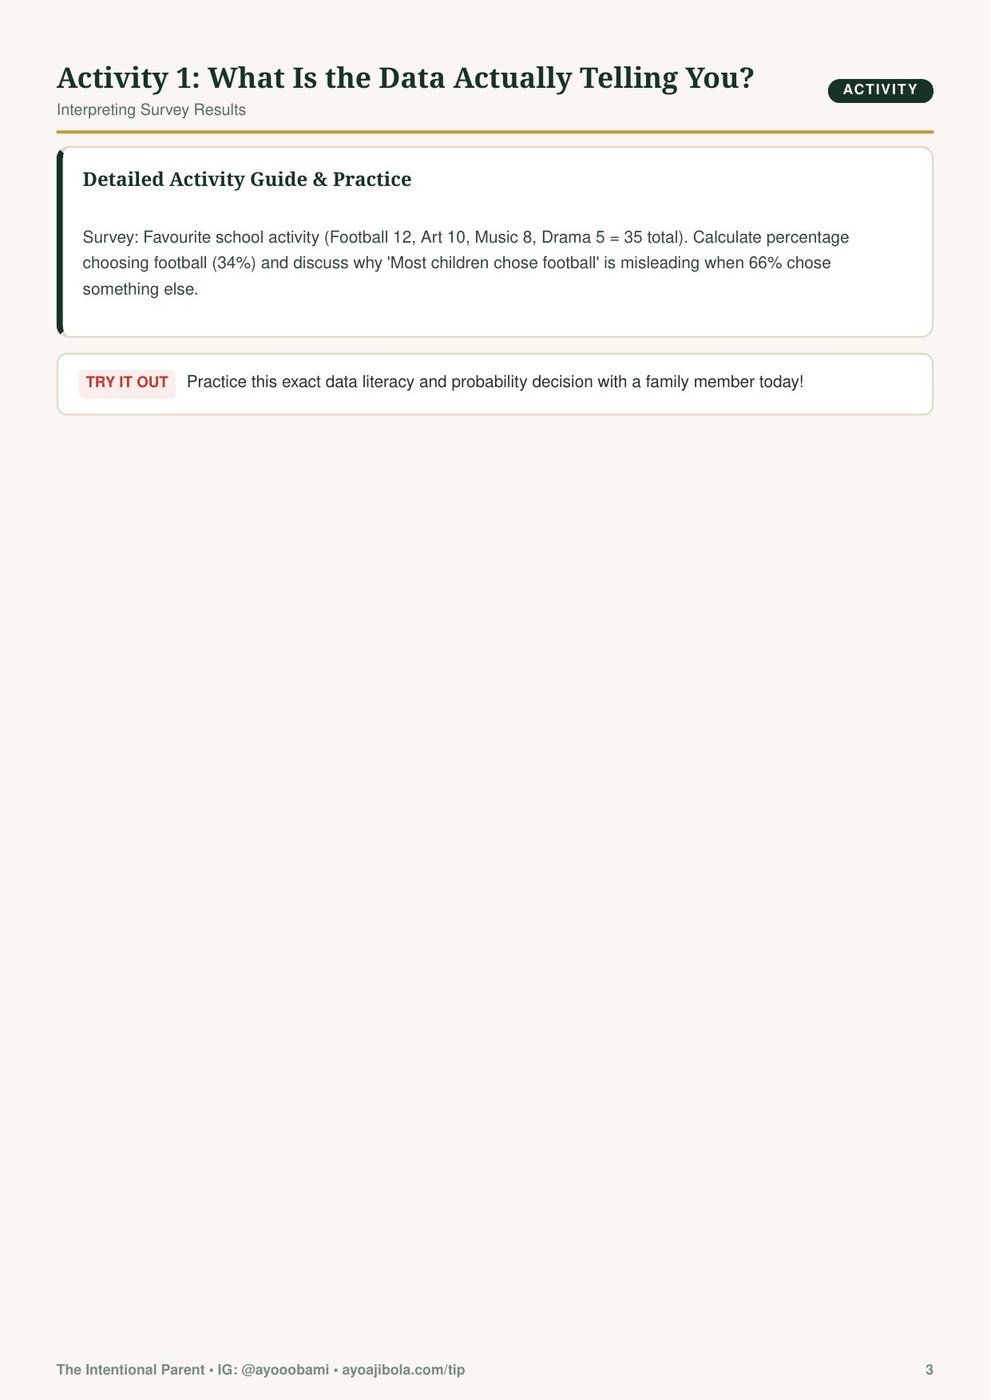
- Reading a survey and what the percentages really say
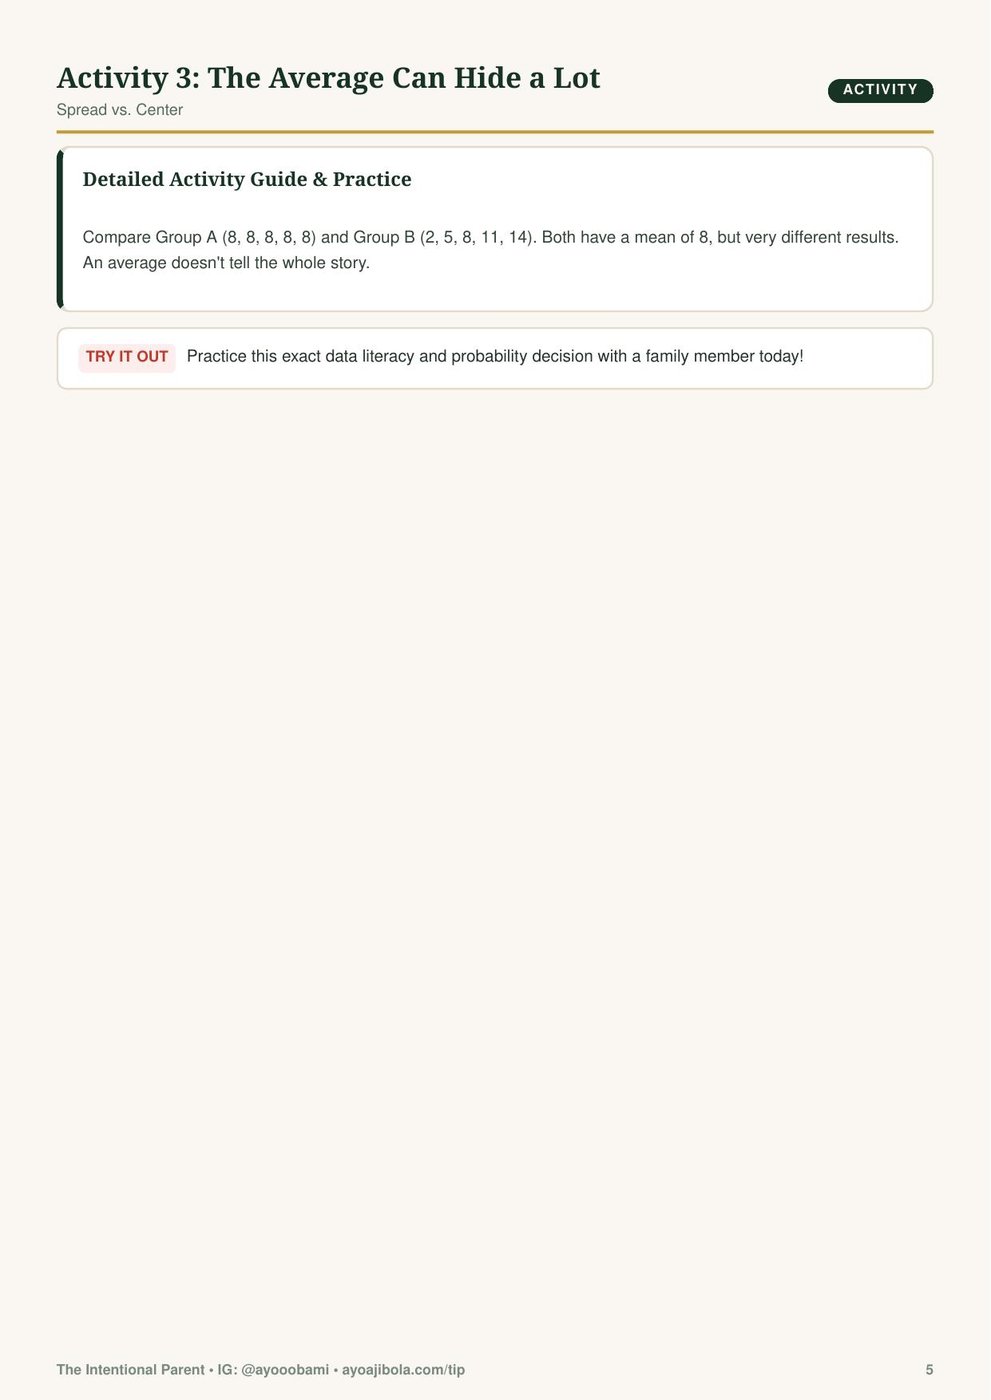
- Mean, median, mode and range compared
- Why an average can hide a very different spread
- Choosing the right average for the situation
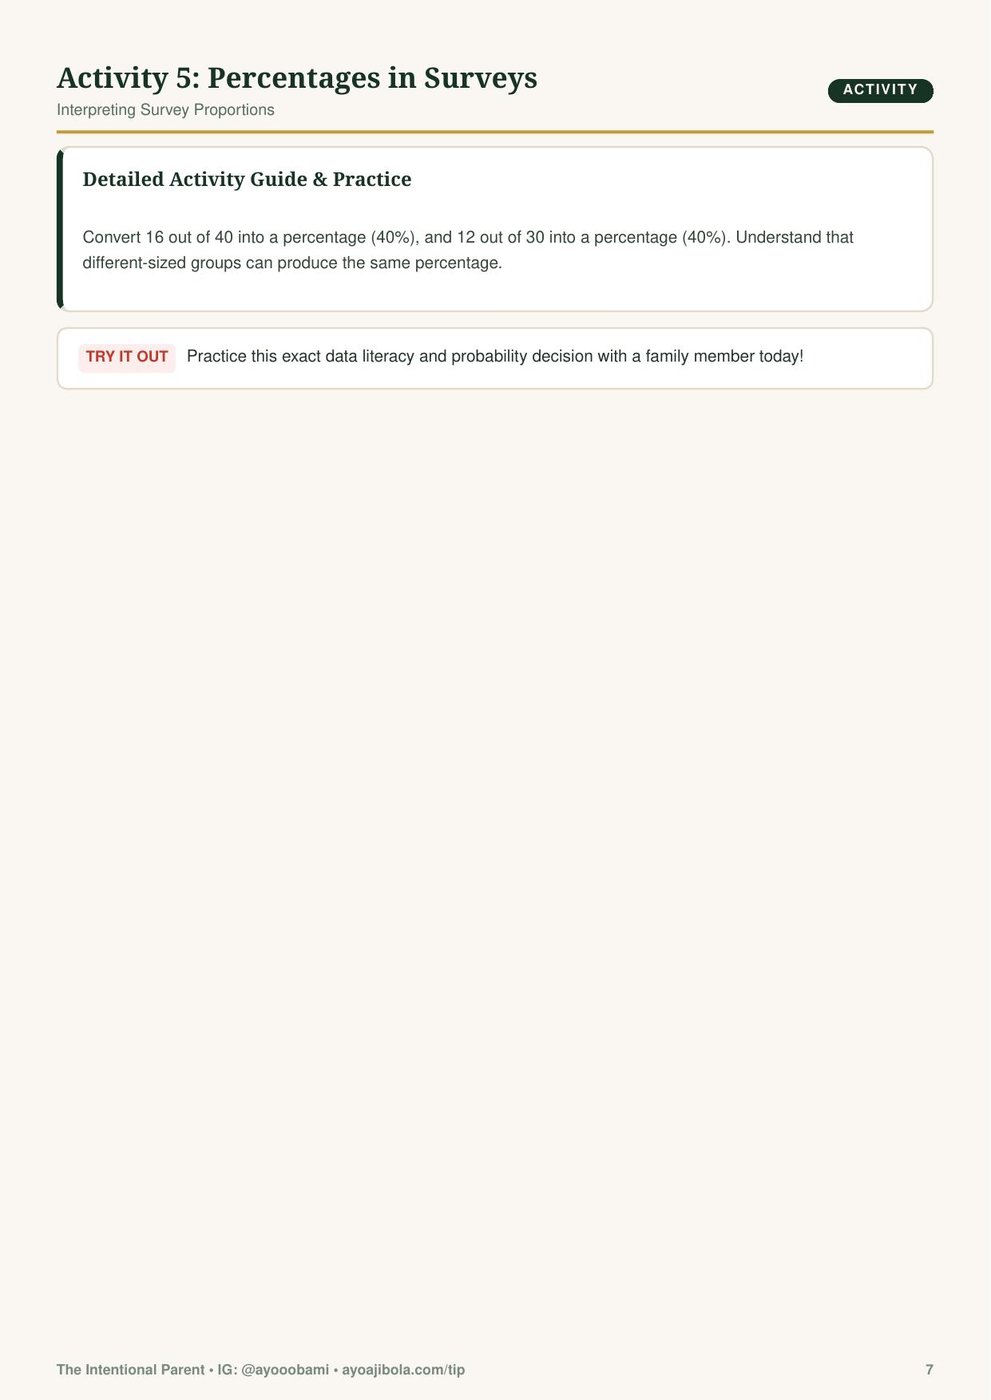
- Percentages in surveys and equal proportions
- Small samples and why 80% can mean four children
- Sample size, bias and who you actually asked
- Leading questions and missing answer options
- Percentage increase, decrease and honest comparisons
- Misleading graphs, truncated axes and missing labels
- Correlation, cause and what else might explain it
- Probability as fractions and percentages, fair games, risk and reward
Who it's for
Parents and carers of children aged 9 to 11 ready to question data, weigh risk and make evidence-based decisions.